
Accounts Payable Dashboard and Reports in Salesforce
Quick Payable's reporting runs on native Salesforce reports and dashboards, not a separate analytics tool. You get a ready-made AP Dashboard for invoice status, upcoming payments, and spend by vendor, plus standard reports you can filter, schedule, and build on with the Salesforce skills your team already has.
Book a Free DemoKey Takeaways
- Reporting in Quick Payable is native Salesforce reporting, so anyone who knows Salesforce reports can build on it.
- Standard reports cover invoice status, upcoming payments, spend by vendor, approval cycle time, and payment status.
- You can schedule any report to email itself, export it to CSV or Excel, and share dashboards by role.
- Track cost per invoice, cycle time, and exception rate. Average teams spend $9.40 and 9.2 days per invoice (Ardent Partners).
- Aging buckets, department or cost-center spend, and due-date alerts aren't included today.
What an Accounts Payable Dashboard Should Show
An AP dashboard answers the questions AP gets asked every day without anyone digging. How many invoices are waiting for approval? What do we owe this week? Who are we spending the most with? Where are approvals getting stuck?
In Quick Payable, those answers come from native Salesforce reports and dashboards, built on the same invoice, vendor, and approval records your team works in. There's no separate analytics tool to learn or sync.
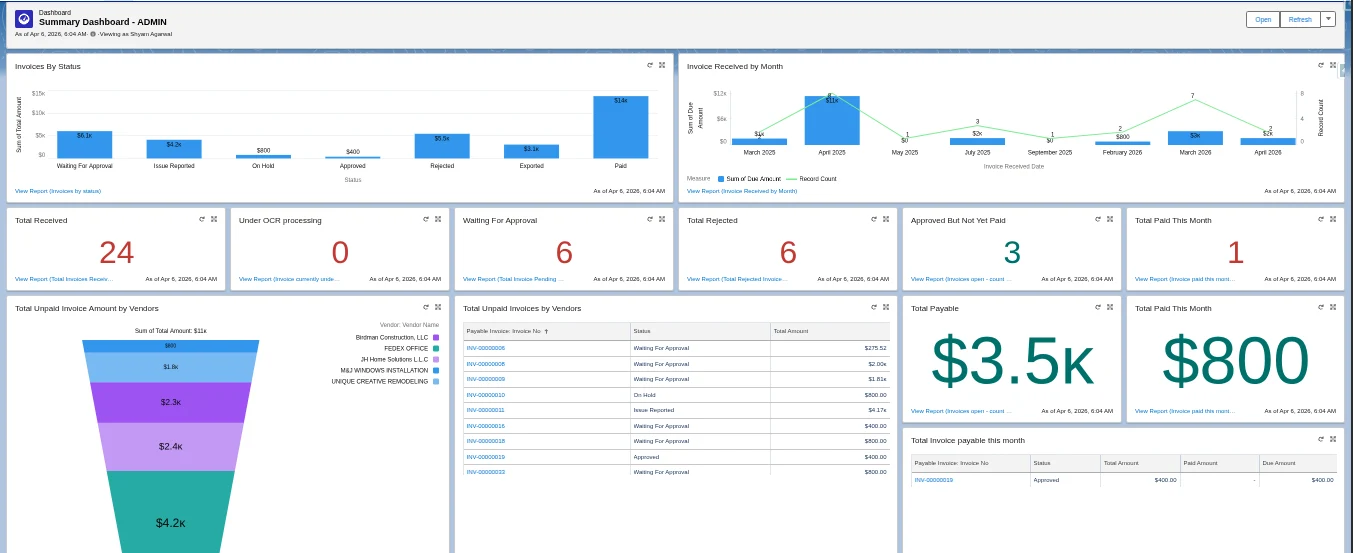
The standard AP Dashboard covers invoice status, upcoming payments, and spend by vendor. Approval cycle time comes from a standard report you can add as a dashboard panel.
Standard Reports and Dashboards Included
| Report or dashboard | What it shows | Who uses it |
|---|---|---|
| AP Dashboard | Real-time invoice status, upcoming payments, and spend by vendor | AP manager, controller |
| Spend by vendor | Invoice volume and dollar amount by vendor | Controller, procurement |
| Approval cycle time | How long invoices spend at each approval stage | AP manager |
| Payment status | Invoices approved and waiting for payment vs. already paid | AP team, treasury |
Payment status ties directly to how you pay vendors. See AP payment scheduling and tracking for how invoices move from exported to paid.
AP KPIs Worth Tracking
| KPI | Why it matters | Benchmark |
|---|---|---|
| Approval cycle time | Shows where invoices get stuck and with whom | 9.2 days average, 3.1 days best-in-class (receipt to approval) |
| Cost per invoice | The standard measure of AP efficiency | $9.40 average, $2.78 best-in-class |
| Touchless rate | How many invoices need no manual step | 32.6% average, 49.2% best-in-class |
| Exception or duplicate rate | How often invoices need manual work | Track the trend against your own baseline |
| Invoice volume by vendor | Shows which vendor relationships to fix first | No single benchmark |
| On-time payment rate | Affects vendor trust and early-pay discounts | Track the trend against your own baseline |
Measure these before you switch and every month after. To estimate your current cost per invoice, use the AP cost calculator.
How to Build a Custom AP Report
Pick a report type
From the Reports tab, create a new report based on Invoices, Vendors, or Approvals.
Add filters
Narrow it down by date range, vendor, or status.
Group the rows
Group by a field like vendor or approval stage to summarize instead of listing every invoice.
Add totals
Add sum, average, or count fields for the numbers you need, like total spend or invoice count.
Save and share
Save it with a clear name so your team can find and reuse it.
How to Build a Custom AP Dashboard
Add your reports
Create a new dashboard and add the reports you want to see as components.
Pick the right chart
Use a bar chart for spend by vendor, a line chart for trends over time, and a table for detailed lists.
Set the running user
Set a running user if everyone viewing the dashboard should see the same data, no matter their own record access.
Share it by role
Share the dashboard with the right role or group, so you don't rebuild it for each person.
Reports and dashboards also support Quick Payable's dark theme if your team prefers it.
Reports by Role
| Role | Reports to start with |
|---|---|
| QP Staff | Invoices pending review, invoices with flagged exceptions |
| Approvers | Invoices pending my approval, my approval history |
| QP Admin / AP manager | Approval cycle time, exception rate, vendor spend summaries |
| Controller / CFO | AP Dashboard, spend by vendor, payment status |
| Auditors | Approval history and the invoice audit trail |
Who sees which reports follows your Salesforce roles and sharing. See AP user roles and permissions.
Scheduling and Exporting Reports
Any report can refresh on a schedule and email itself to the people who need it, like a weekly payment status report to your AP manager before the payment run. Any report can also be exported to CSV or Excel for offline analysis or for systems outside Salesforce.
Scheduling sends a refreshed report on a set schedule. It doesn't trigger alerts based on conditions, like an invoice sitting unapproved too long. A weekly scheduled report sorted by age covers most of that need.
What's Not Included Today
| Report | Status | What to do instead |
|---|---|---|
| Aging buckets (current, 30, 60, 90+ days) | Not in Quick Payable | Filter or group invoices by date in a custom report. A full AR aging report is available in Quick Receivable for receivables. |
| Spend by department or cost center | Not available today | Use spend by vendor |
| Conditional alerts (due soon, stuck too long) | Not supported | Schedule a weekly report sorted by due date or age |
We'd rather you know this before a demo than after. If any of these are must-haves, raise them on the call. For receivables, see Quick Receivable.
Is the Quick Payable AP Dashboard Right for You?
Strong fit
- Your company runs on Salesforce
- Someone on your team already builds Salesforce reports
- You want AP reports next to sales and operations data
- Your controller asks for the same numbers every week
- You want to track cycle time and cost per invoice
Check first
- You don't use Salesforce
- You need AP aging buckets or department spend out of the box
- You need automatic due-date alerts
Quick Payable is built by Differenz System, a Salesforce consulting company since 2013 with ISO 27001:2022 certification. Setup steps are in the Quick Payable documentation.
See Where Every Invoice Stands, Without Asking
Book a Free DemoAccounts Payable Dashboard FAQs
What does the Quick Payable AP Dashboard show?
The AP Dashboard gives a real-time view of invoice status, upcoming payments, and spend by vendor.
What standard reports come with Quick Payable?
Quick Payable includes the AP Dashboard plus spend by vendor, approval cycle time, and payment status reports.
Are Quick Payable reports native Salesforce reports?
Yes. Reporting is built on native Salesforce reports and dashboards, so anyone who knows Salesforce reporting can build on what is included.
Can I build my own AP reports?
Yes. Create a report based on Invoices, Vendors, or Approvals, add filters, group rows, add summary fields, and save it for your team.
Can I schedule AP reports by email?
Yes. Any report can refresh on a schedule and email itself to specific users, such as a weekly payment status report to your AP manager.
Can I export AP data to Excel?
Yes. Any report can be exported to CSV or Excel for offline analysis or to share with systems outside Salesforce.
Does Quick Payable have an AP aging report?
Not today. You can filter or group invoices by date in a custom report. A full aging report is available in Quick Receivable for accounts receivable.
Can I see spend by department or cost center?
Not currently. Spend reporting in Quick Payable breaks down by vendor.
Does Quick Payable send alerts for invoices that are stuck or due soon?
No. Conditional alerts are not supported today. Most teams schedule a weekly report sorted by due date or age instead.
What AP KPIs should I track?
Start with approval cycle time, cost per invoice, touchless rate, exception rate, and on-time payment rate. Ardent Partners reports average teams spend $9.40 and 9.2 days per invoice.
How much does Quick Payable cost?
Quick Payable is $100 per user per month with a 15-day free trial, and every feature, including reports and dashboards, is included.
See the AP Dashboard in Your Own Org
Book a demo and tell us the three numbers your controller asks for most. We'll show you where they live in Quick Payable.
$100 per user per month · 15-day free trial · Every feature included